Analytics & reporting
Proof the program is working
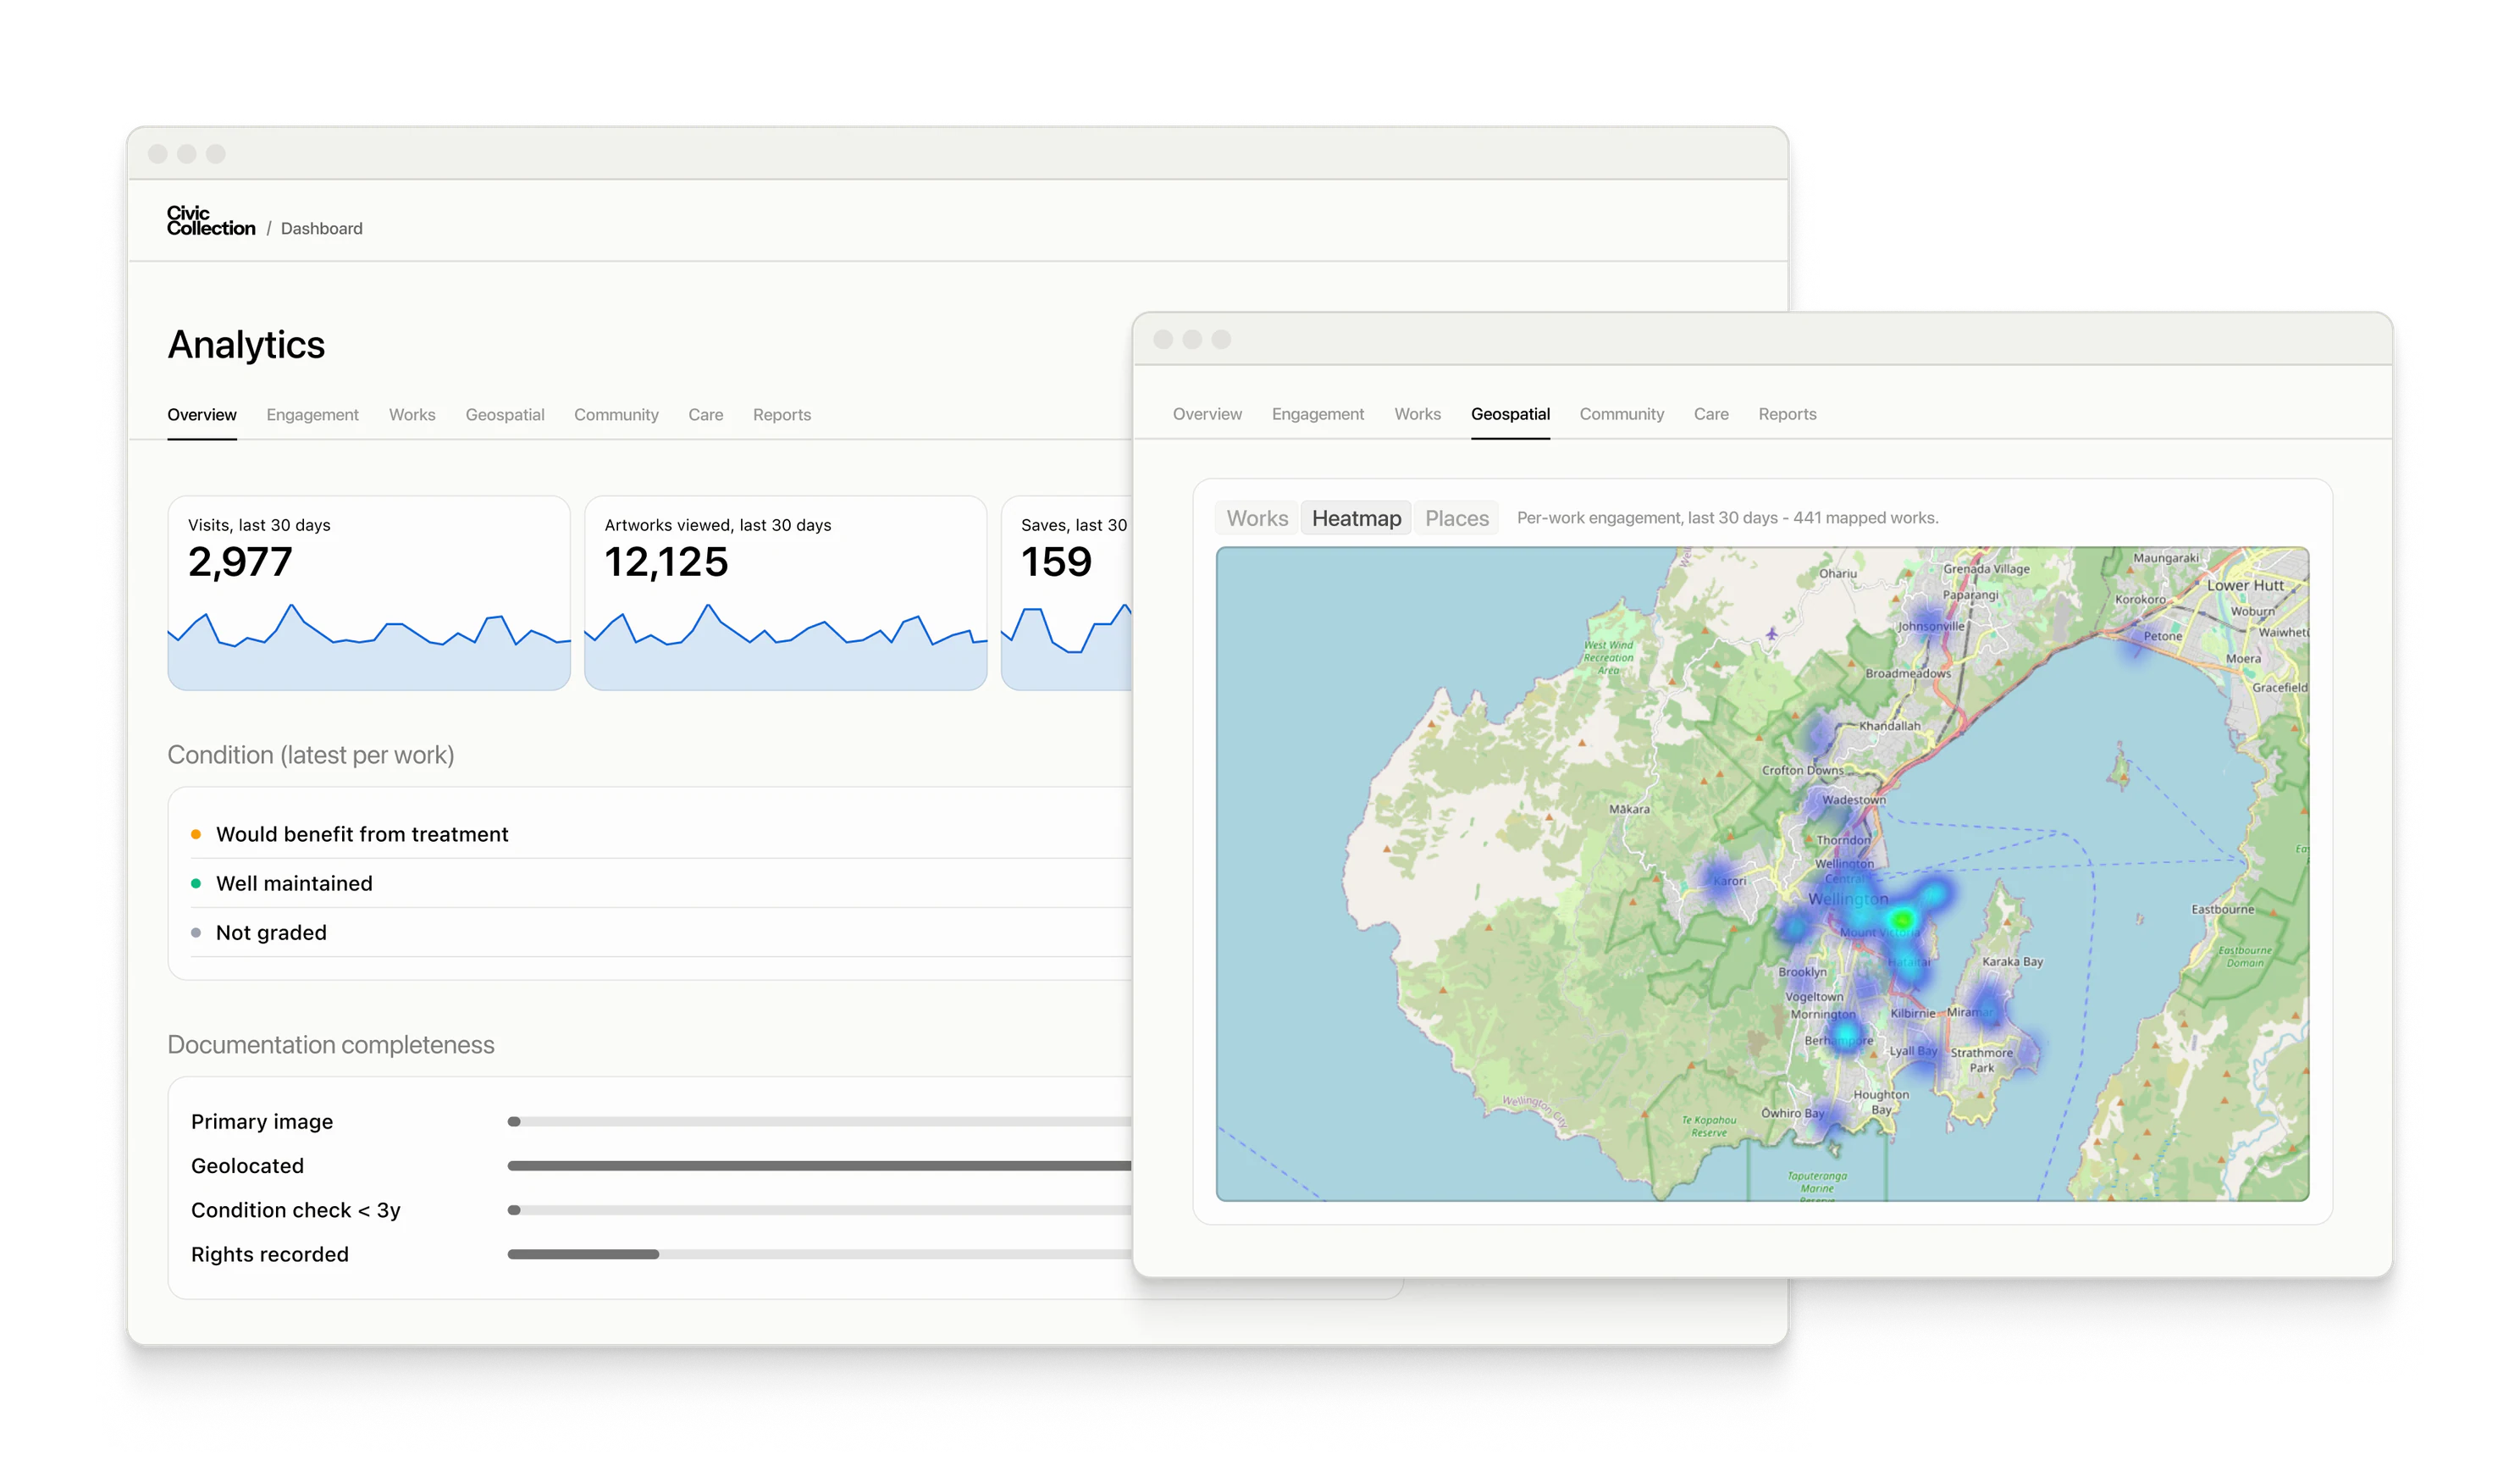
Care, contributions, and engagement: the numbers a program takes to council.
Three things a program has to answer for
Is it cared for, is the community engaged, is it being found?
- Explore collections management →
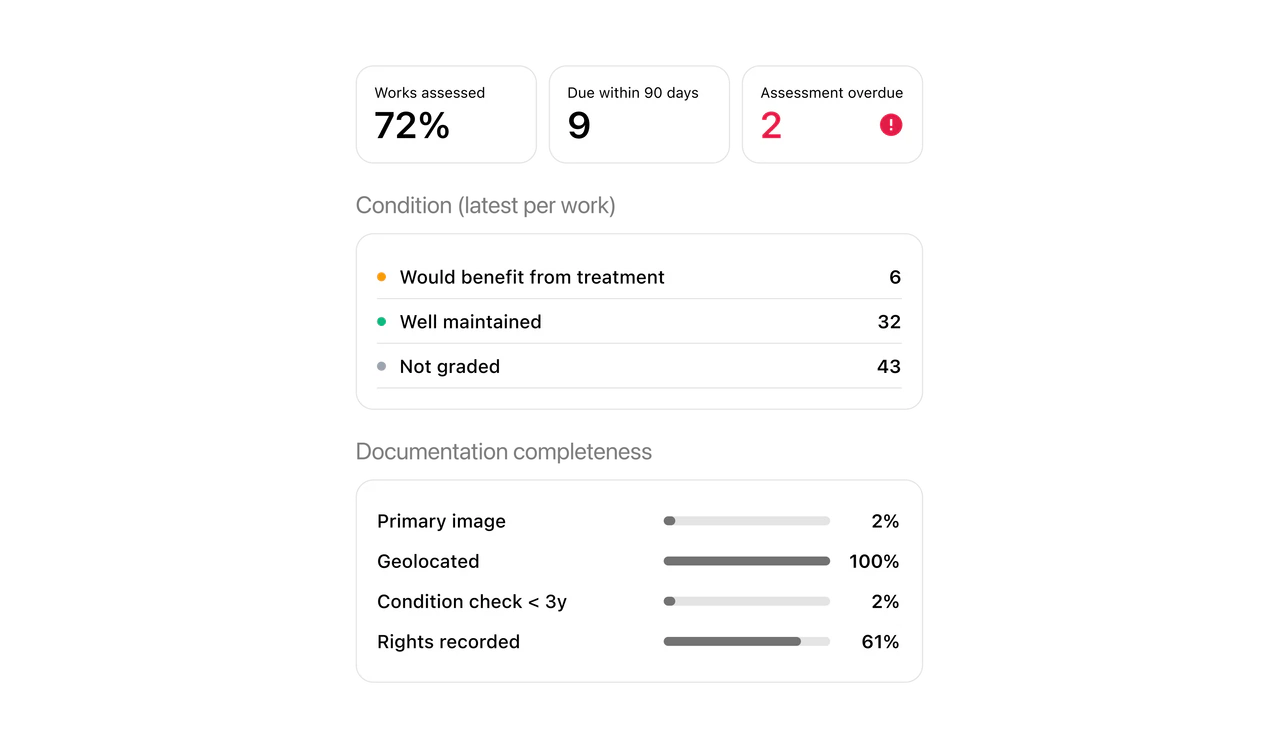
Care and condition
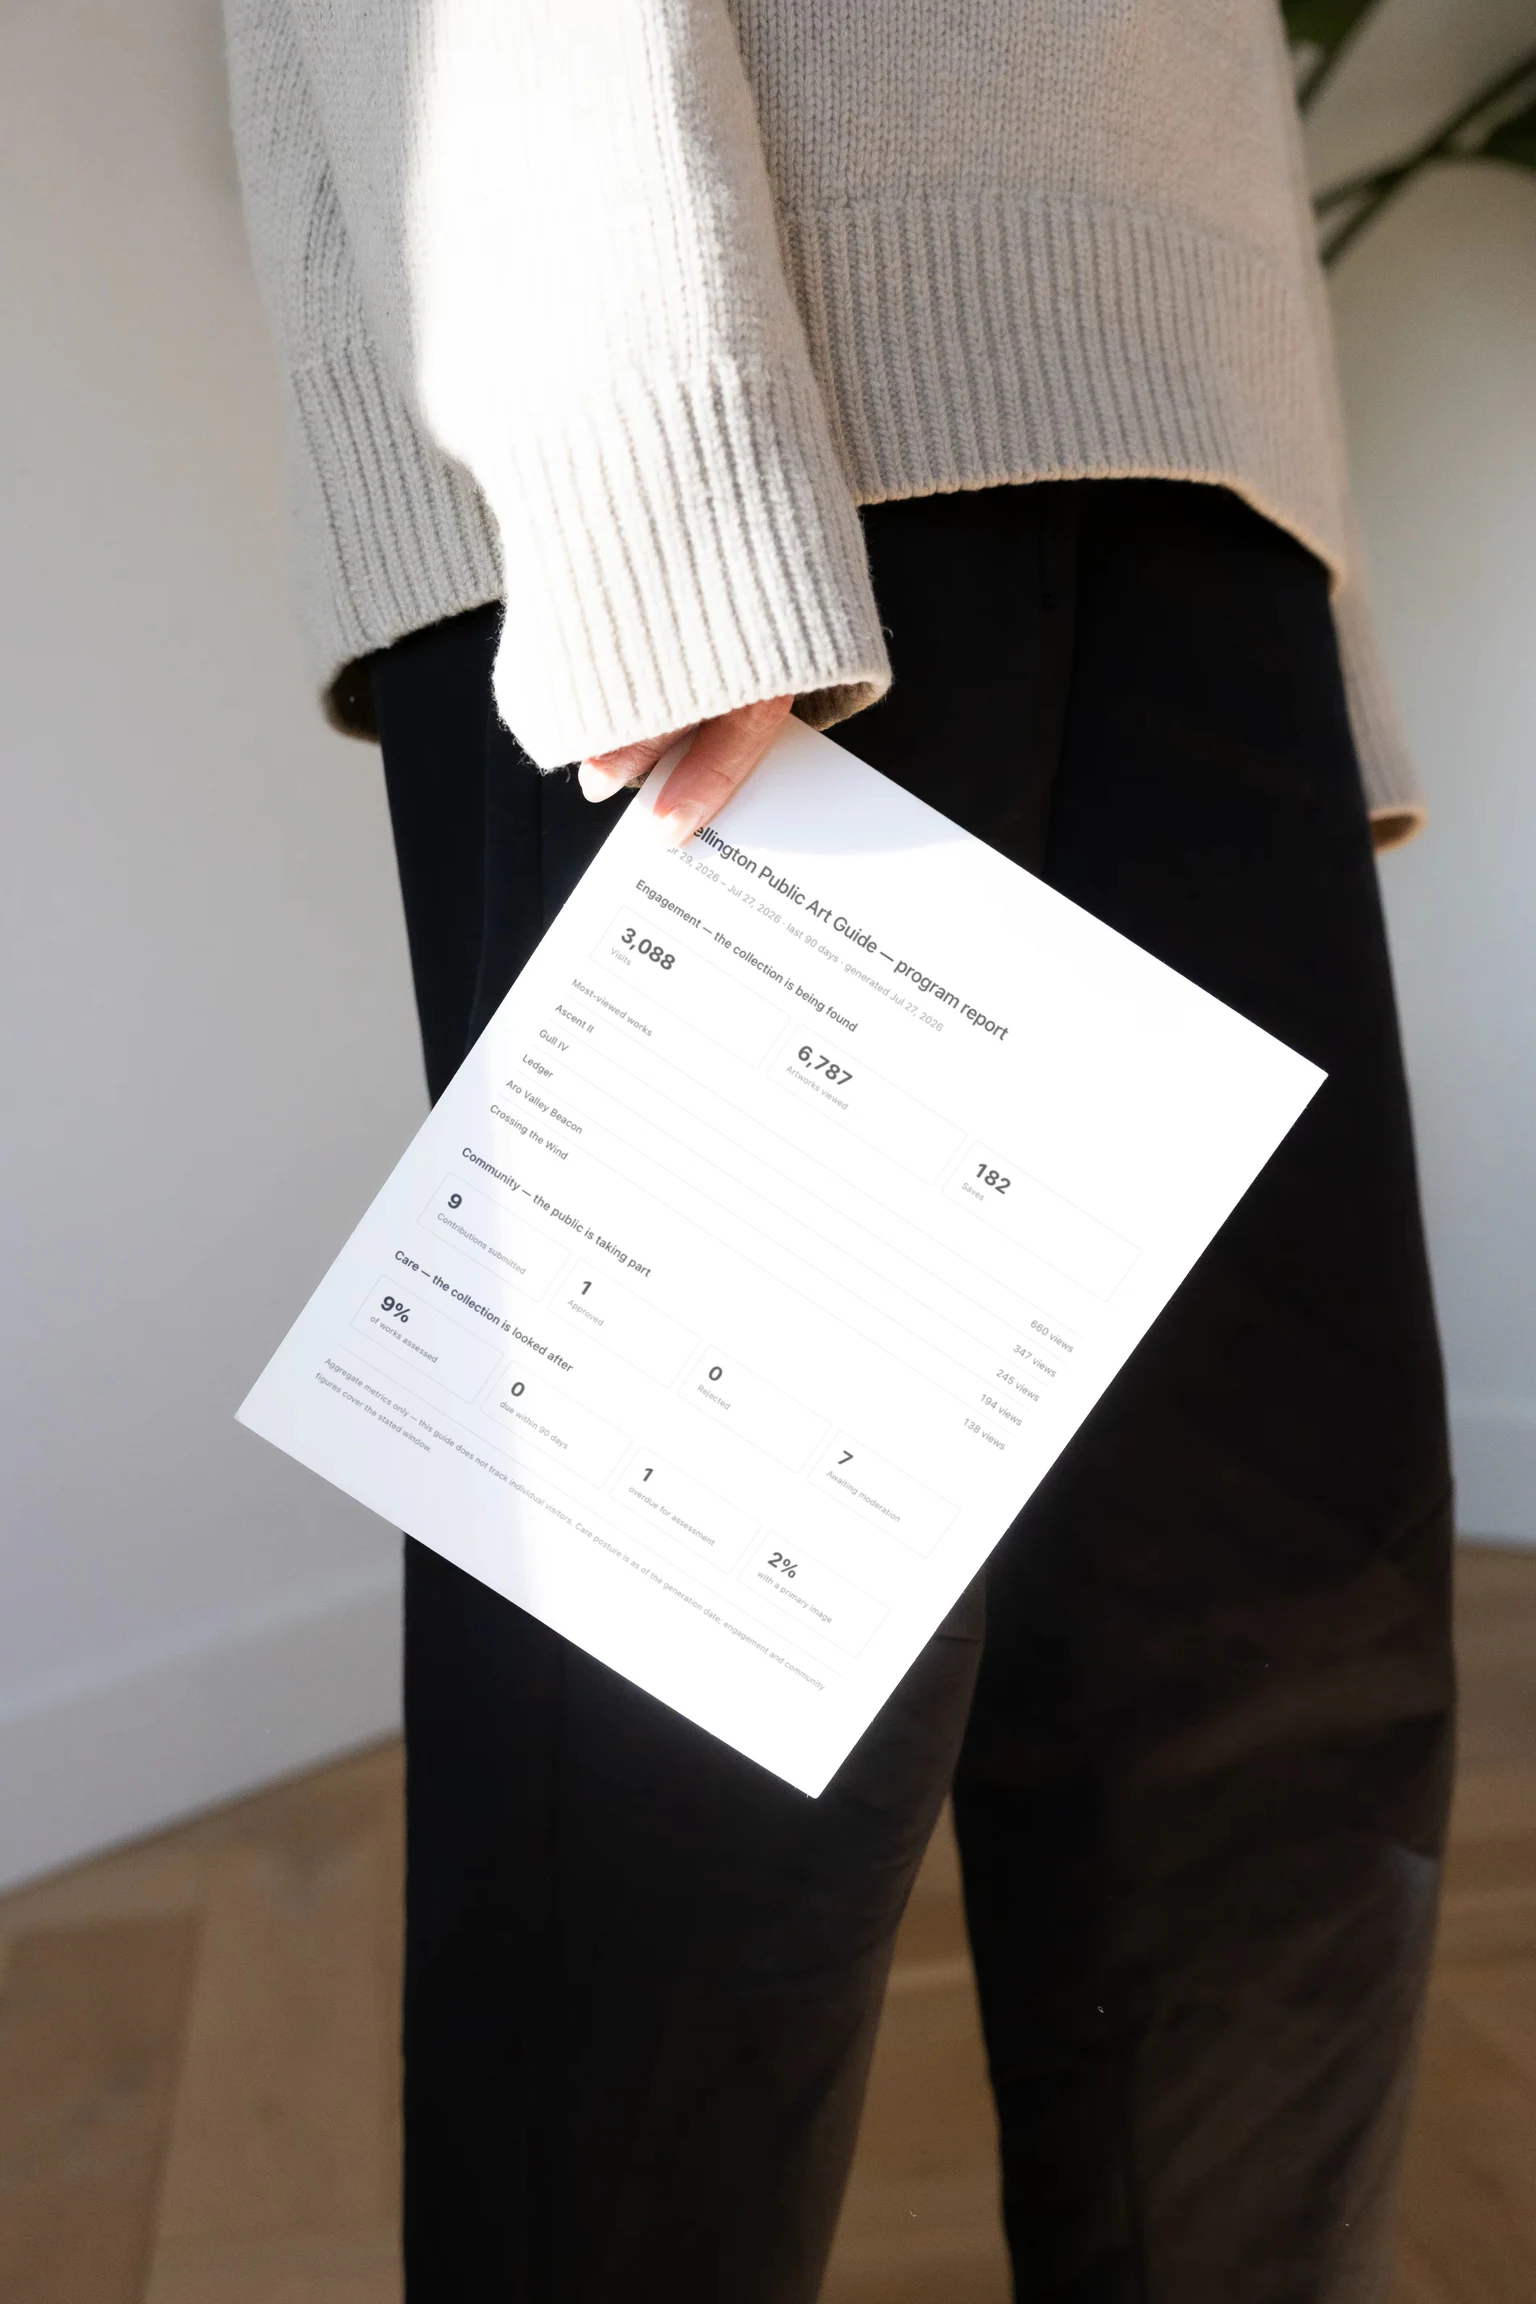
Condition and maintenance posture across the collection, ready for the reporting percent-for-art funding expects.
- Explore community contributions →
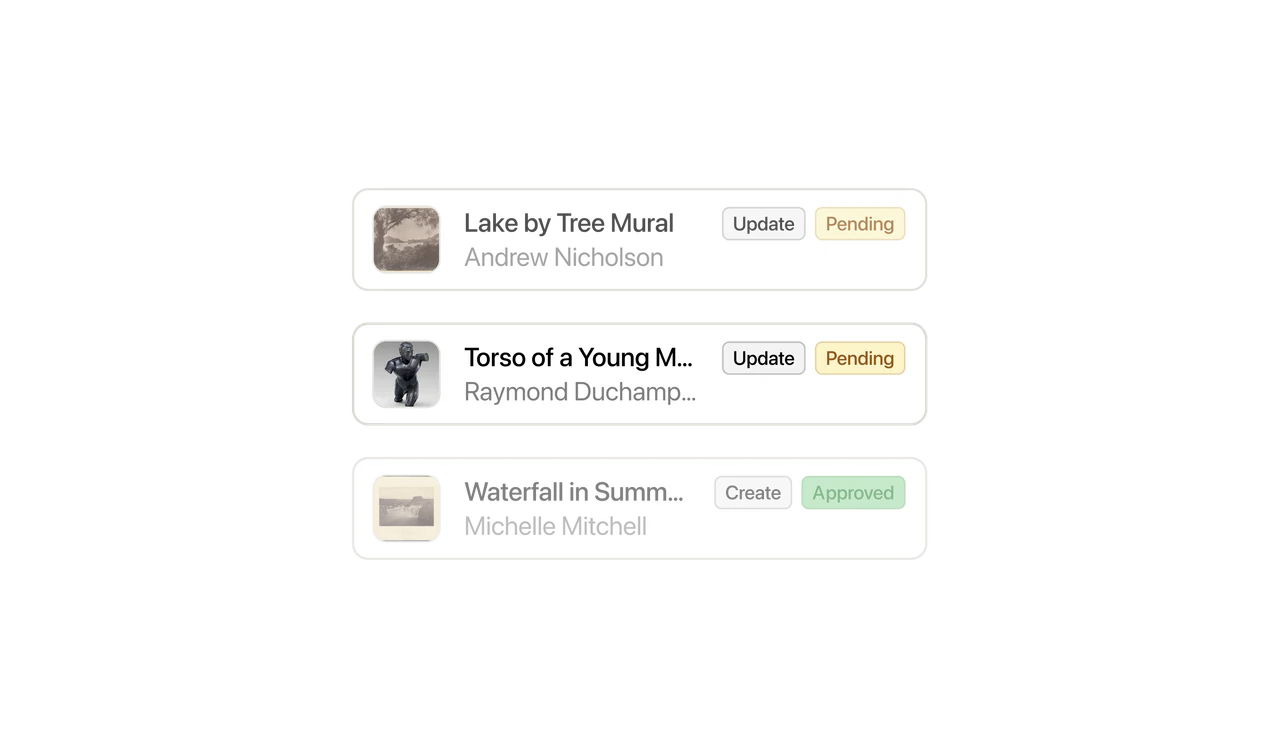
Community activity
What people are photographing, flagging, and proposing, drawn from the moderation queue.
-
Reach and engagement
Visits, artworks viewed, tours taken, and saves: the supporting evidence that the collection is reaching people.
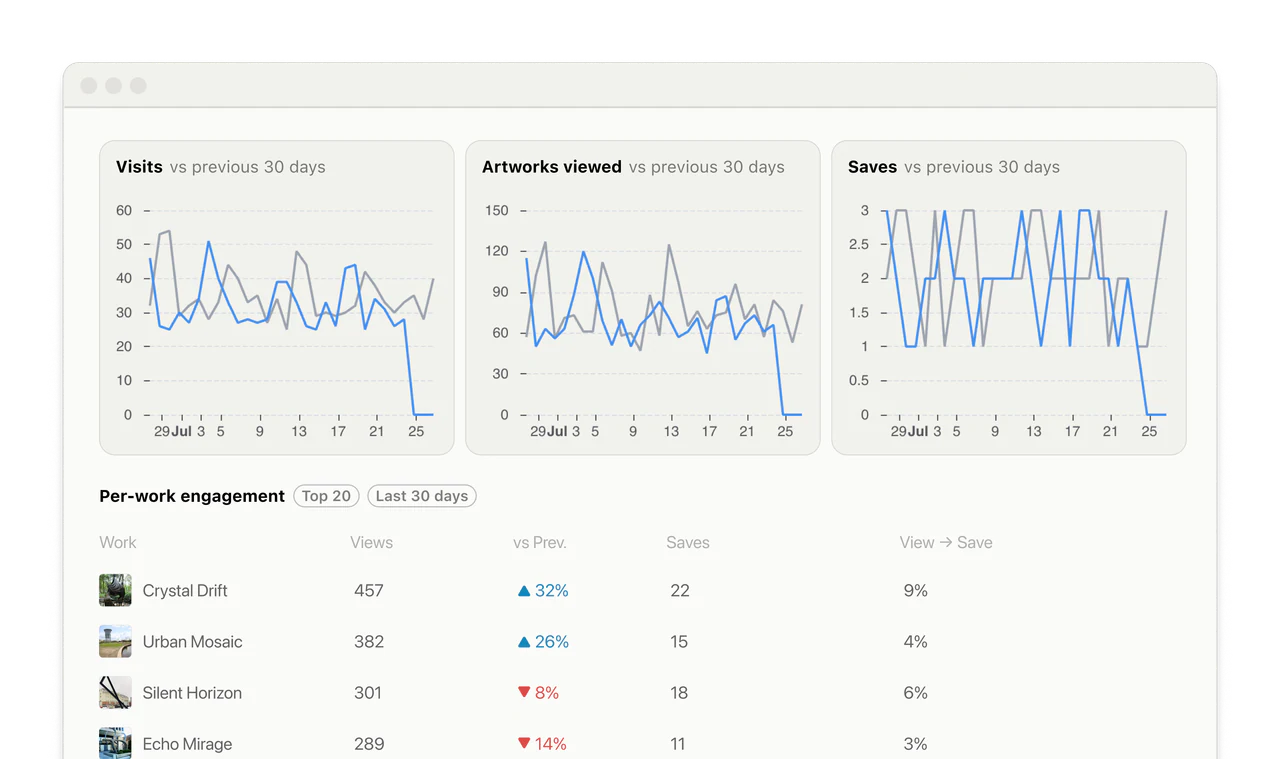
A living guide is also a record of its use
Every condition assessment logged, contribution moderated, and record kept current is evidence of a program doing its work. The guide gathers that evidence, with how people find and use the collection alongside it, into a picture you can hand to a council or a funder. No spreadsheet of your own to keep.
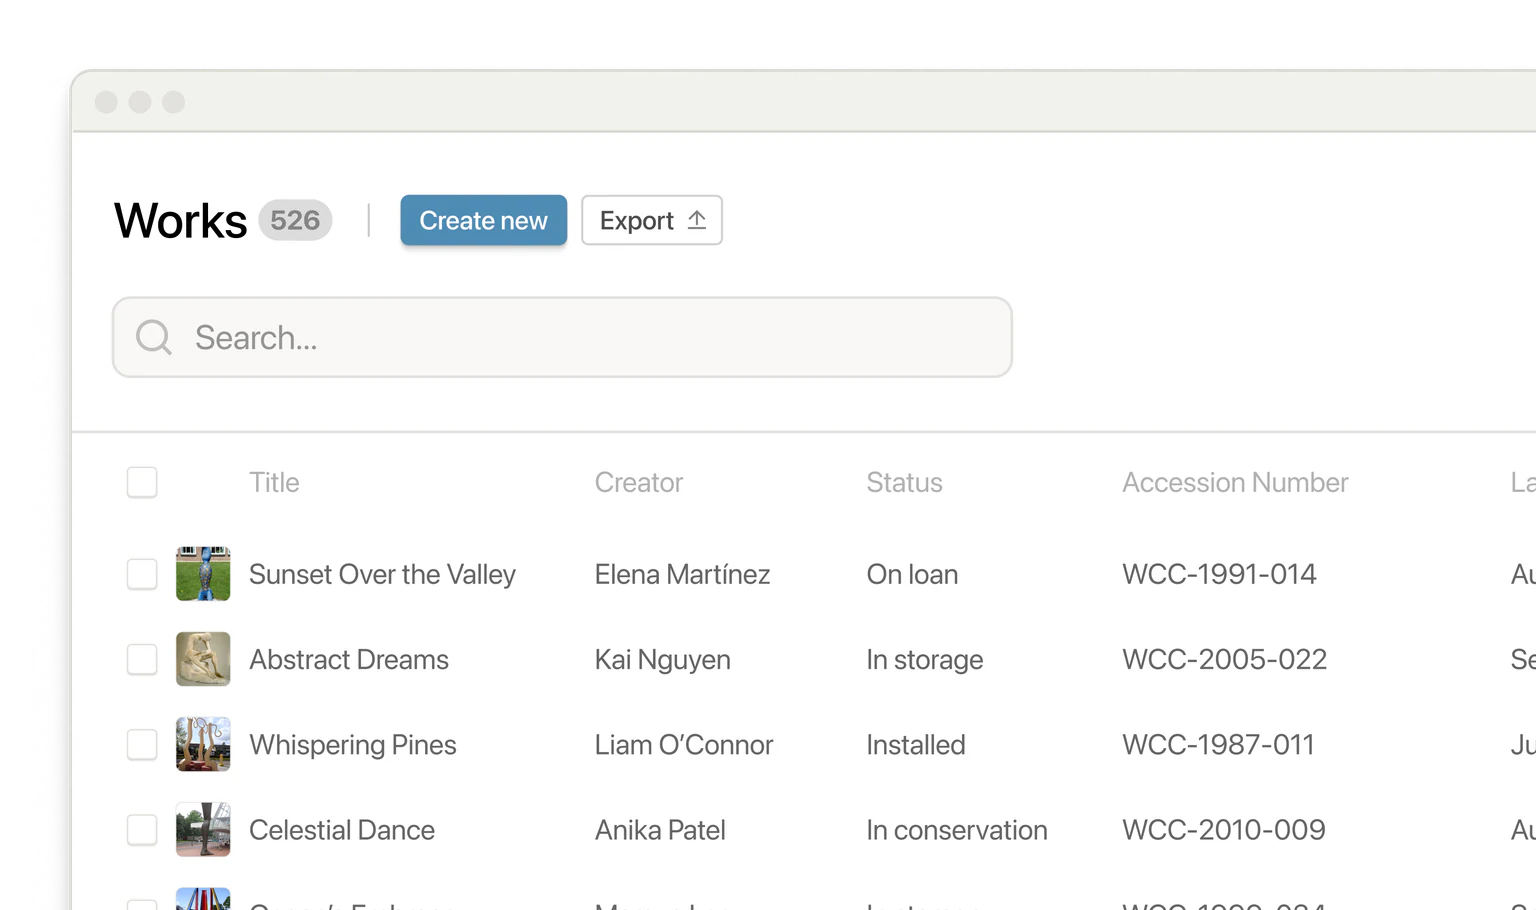
Built for the people who defend the program
Metrics that respect the audience and the collection.
-
Led by the program's own work
Reports lead with what your team controls: records kept current, assessments logged, contributions moderated. Visits are context, never the whole story.
-
One place, not three
Care, participation, and reach in a single view, not stitched together from separate tools.
-
Measured with respect
Aggregate patterns over individual tracking: privacy-respecting by default.
-
Yours, in full
Every record and its history exports at any time. We don't hold your collection hostage.
Council-ready, not spreadsheet-ready
The numbers come out of the guide already shaped for the audiences that matter: a council presentation, a funder's report, a percent-for-art obligation. Defend the budget you have and make the case for the one you want.
You publish, we operate
The reporting is part of the service.
-
No analyst, no extra tool
Your team pulls the numbers from the same simple admin it publishes with. Nothing separate to procure or learn.
-
Operated for years, not a season
We host, maintain, and improve the guide after launch, and the reporting comes with it.
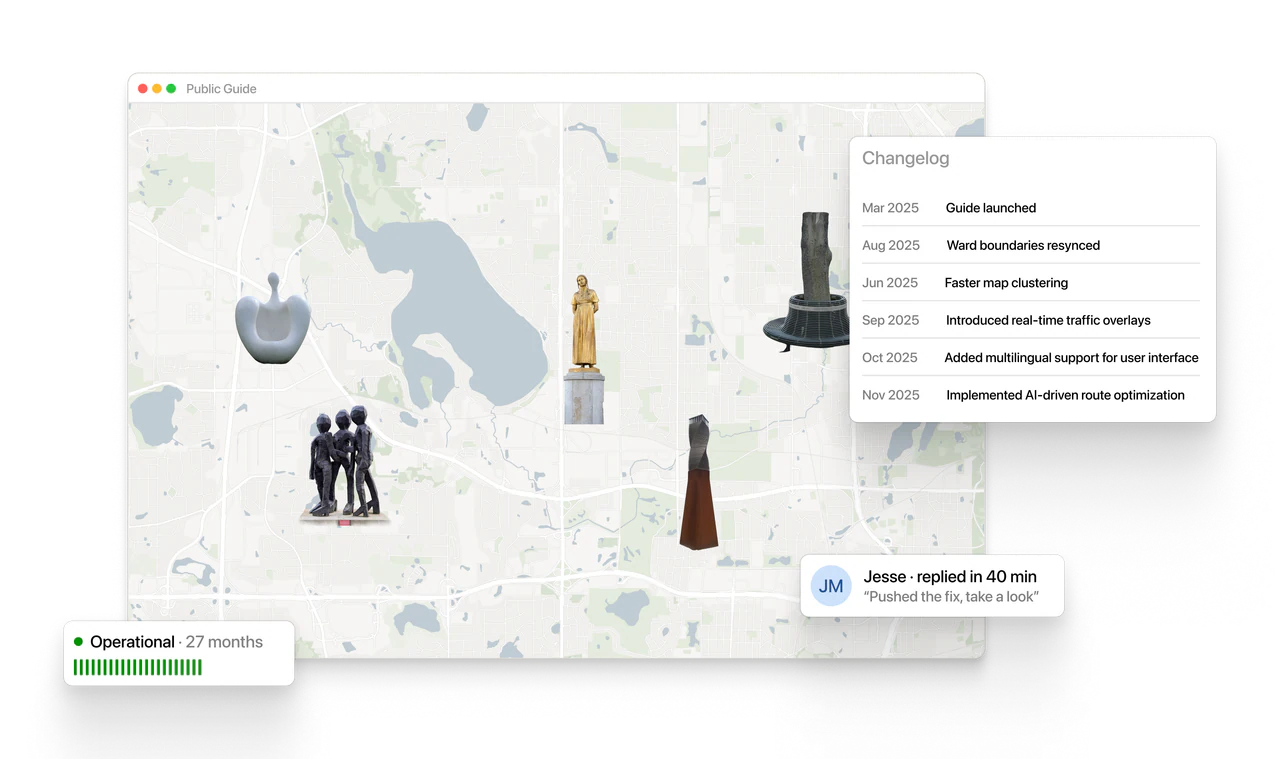
The part worth seeing live
Reporting is best judged on a real collection, so it's built into the demo environment. We'd rather walk you through it than describe it.
FAQs
What can you actually measure?
The condition and care posture of the collection, community contribution activity from the moderation queue, and reach and engagement (visits, artworks viewed, tours taken, saves).
Is this available today?
Analytics is built into the demo environment, and it's the part worth seeing live. Book a demo and we'll walk through the reporting on a real collection, so you see exactly what a program gets.
Do you track individual visitors?
No. Reporting is built on aggregate patterns, not individual tracking: privacy-respecting by default, in keeping with how public-sector guides should treat the people who use them.
Can we use it for council or percent-for-art reporting?
That's what it's for. The numbers come shaped for a council update, a funder's report, or a percent-for-art obligation: evidence the collection is being found, used, and cared for.
Do we need a developer or an analyst?
No. The reporting lives in the same simple admin your team already uses to publish: no developer in the loop, no separate analytics tool to learn.
Do we own the data?
Always. Your catalog and its history are yours, exportable in full at any time.
Ready to make the case for the collection?
Analytics is best seen live. We'll walk you through it.